Bromine: 2024 World Market Review and Forecast to 2033
About Bromine Market
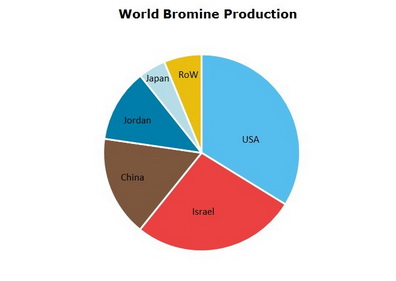
- three major bromine-producing areas are the USA, the Dead Sea (Israel and Jordan) and China
- USA is the leading bromine manufacturer; it is estimated to account for about 35% of the world total
- overall, 98% of total bromine supply is from the USA, Israel, China, Jordan, and Japan
- flame retardants - the largest application area for bromine - witnessed a decline as a result of environmental concerns (especially in Europe)
- water treatment and drilling fluids production continue to be the growing applications for bromine
- bromine market is not expected to show significant growth, average rates of 1-2% are anticipated
- the USA share in global supply may go down as capacity expansions are foreseen in Jordan and Israel
The Market Review is a source for detailed information on the market situation. The report contains descriptive and analytical parts, enriched with tables and figures for national and global markets. Market forecasts for the next ten years complete the report.
Scope
Geographically market report covers:
- World
- Countries
Timeframe of the market report:
- Present situation
- Historical background
- Ten-year forecast
Global market analysis includes:
- Production and consumption
- Prices
- 10-year market forecast
- Downstream markets
A region/country market overview comprises:
- Production/consumption balance
- Export and import
- Manufacturers
Reasons to Buy
The immediate benefits of buying this report are as follows:
- Detailed statistics give clear picture of current market situation;
- Extensive price charts draw particular pricing trends in the recent years;
- Production/consumption charts backed with export/import tables outline country’s market position and value;
- Search for partners and suppliers is facilitated;
- Distinct market forecast aids the decision-making process.
*Please note that "Bromine: 2024 World Market Review and Forecast" is a half ready publication and contents are subject to changes and additions. We have all data necessary for report preparation but it needs to be retrieved from our databases, organized in a report, updated with the latest information and thus the complete study will be presented. This process takes 4-5 business days after the order is placed. Thus, our clients always obtain a revised and updated version of each report. Please note that we do not charge for an updating procedure.
DISCLAIMER
RESEARCH METHODOLOGY
1. WORLD BROMINE MARKET
1.1. Commodity overview
Description
Application spheres
Worldwide resources
Substitutes
1.2. Bromine market in 2018-2023
Production, major manufacturers’ profiles
Bromine demand, consumption structure
1.3. Prices
2. EUROPEAN MARKET OF BROMINE
Here and after a country market analysis covers the following (depending on market):
– production in 2018-2023
– consumption in 2018-2023
– export and import of bromine and fluorine
2.1. Germany
3. CIS COUNTRIES MARKET OF BROMINE
3.1. Azerbaijan
3.2. Turkmenistan
3.3. Ukraine
4. ASIA PACIFIC MARKET OF BROMINE
4.1. China
4.2. India
4.3. Japan
5. MIDDLE EAST MARKET OF BROMINE
5.1. Israel
5.2. Jordan
8. BROMINE MARKET FORECAST TO 2033
8.1. Bromine market trends up to 2033
8.2. Supply forecast
8.3. Demand forecast, downstream markets prospects
World reserves of bromine
World production
World production by country
Bromine supply/demand in Germany
Trade of bromine and fluorine in Germany
Bromine supply/demand in Azerbaijan
Trade of minerals in Azerbaijan
Bromine supply/demand in Turkmenistan
Trade of minerals in Turkmenistan
Mineral supply/demand in Ukraine
Trade of bromine and fluorine in Ukraine
Mineral supply/demand in China
Trade of bromine and fluorine in China
Mineral supply/demand in India
Trade of bromine and fluorine in India
Mineral supply/demand in Japan
Trade of bromine and fluorine in Japan
Mineral supply/demand in Israel
Trade of bromine and fluorine in Israel
Mineral supply/demand in Jordan
Trade of bromine and fluorine in Jordan
Bromine market forecast up to 2033
Ask a question or Order by email
More Reports
| Title | Date | Pages | Price |
|---|---|---|---|
| Apr, 2024 | 130 | US$ 1,899.00 | |
| Apr, 2024 | 132 | US$ 3,300.00 | |
| Apr, 2024 | 66 | US$ 2,250.00 |