Chlorine (CL): 2024 World Market Outlook and Forecast up to 2033
Chlorine market trends, developments and prospects:
- the main application is the production of polyvinyl chloride (about 40% of total world demand)
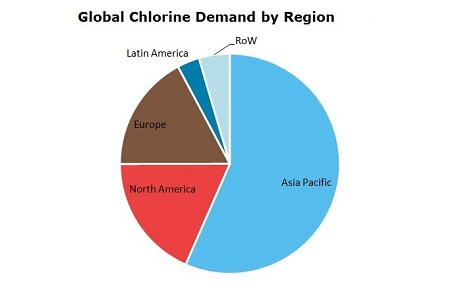
- Asia Pacific is the largest chlorine producer accounting for nearly 60% of global total, followed by North America and Europe with 19% and 17%, respectively
- up to 70% of chlor-alkali variable costs are for energy; development of new technologies aims at reducing energy costs
- Western European producers are committed to close or convert to membrane technolo-gy their mercury cell plants no later than in 2033
- Main growth in chlorine market demand will be provided by Asia Pacific region; decline in consumption in Western Europe will be balanced by growth in Eastern Europe; growth rates in North America will be moderate
 Chlorine (CL) 2024 World Market Outlook and Forecast up to 2033 grants access to the unique data on the examined market. Having used a large variety of primary and secondary sources, our research team combined, canvassed and presented all available information on product in an all-encompassing research report clearly and coherently.
The market report not only contains a detailed market overview but also offers a rich collection of tables and figures, thus providing an up-close look at country, regional and world markets for product. It also includes a ten-year forecast showing how product market is set to develop.
Report Scope
Geographically chlorine market report covers:
- World
- Regions
- Countries
Timeframe of chlorine market report:
- Present situation
- Historical background
- Ten-year forecast
Global chlorine market analysis includes:
- Capacity
- Production and consumption
- Trade statistics
- Prices
- Projects
- End-use sector
A region/country chlorine market overview comprises:
- Capacity
- Supply/demand
- Prices
- Export and import
- Manufacturers and suppliers
Reasons to Buy
- The report provides the reader with unrivalled knowledge of the chlorine market
- Unique examination of the market in different geographical settings and analysis of global and regional trends influencing the industry assist in the effective business planning
- You will push up you company’s sales and deepen foothold in the industry by gaining a full understanding of the market
- Thorough assessment of the competitive environment and in-depth overview of market participants help to understand who stands where on the market and identify prospective business partners
- Comprehensive chlorine market forecast will improve the decision-making process
*Please note that "Chlorine (CL): 2024 World Market Outlook and Forecast up to 2033" is a half ready publication and contents are subject to changes and additions. We have all data necessary for report preparation but it needs to be retrieved from our databases, organized in a report, updated with the latest information and thus the complete study will be presented. This process takes 5-7 business days after the order is placed. Thus, our clients always obtain a revised and updated version of each report. Please note that we do not charge for an updating procedure.
DISCLAIMER
RESEARCH METHODOLOGY
1. INTRODUCTION: CHLORINE PROPERTIES AND USES
2. CHLORINE MANUFACTURING PROCESSES
3. CHLORINE WORLD MARKET
3.1. World chlorine capacity
– Capacity broken down by region
– Capacity divided by country
– Manufacturers and their capacity by plant
3.2. World chlorine production
– Global output dynamics
– Production by region
– Production by country
3.3. Chlorine consumption
– World consumption dynamics
– Consumption trends in Europe
– Consumption trends in Asia Pacific
– Consumption trends in North America
– Consumption trends in Latin America
– Consumption trends in Middle East and Africa
3.4. Chlorine global trade
– World trade dynamics
– Export and import flows in regions
3.5. Chlorine prices in the world market
4. CHLORINE REGIONAL MARKETS ANALYSIS
Each country section comprises the following parts:
– Total installed capacity in country
– Production in country
– Manufacturers in country
– Consumption of in country
– Export and import in country
– Prices in country
4.1. Chlorine European market analysis
Countries covered:
– Austria
– Belgium
– Czech Republic
– Germany
– Netherlands
– Norway
– Poland
– Portugal
– Russia
– Spain
– Ukraine
– and others
4.2. Chlorine Asia Pacific market analysis
Countries included:
– Australia
– Azerbaijan
– China
– India
– Indonesia
– Japan
– Malaysia
– Philippines
– Singapore
– South Korea
– Tajikistan
– Uzbekistan
– and others
4.3. Chlorine North American market analysis
Countries under consideration:
– Canada
– USA
4.4. Chlorine Latin American market analysis
Countries overviewed:
– Argentina
– Brazil
– Chile
– Colombia
– Mexico
– Venezuela
– and others
4.5. Chlorine Africa & Middle East market analysis
Countries examined:
– Egypt
– Libya
– Morocco
– Qatar
– Saudi Arabia
– South Africa
– Turkey
– UAE
– and others
5. CHLORINE MARKET FORECAST TO 2033
5.1. Chlorine capacity and production forecast up to 2033
– Global production forecast
– On-going projects
5.2. Chlorine consumption forecast up to 2033
– World market projections
– Consumption forecast in Europe
– Consumption forecast in Asia Pacific
– Consumption forecast in North America
– Consumption forecast in Latin America
– Consumption forecast in Middle East and Africa
5.3. Chlorine market prices forecast up to 2033
6. KEY COMPANIES IN THE CHLORINE MARKET WORLDWIDE
Each company analysis covers (depending on data availability):
– Company overview
– Business segmentation
– Company SWOT analysis
– Chlorine production technology, specification
– Chlorine production capacity and plants, share in the global industry
– Recent company activities in chlorine market
7. CHLORINE END-USE SECTOR
7.1. Consumption by application
7.2. Downstream markets review and forecast
Global chlorine capacity by region in 2023
Capacity by country in 2023
Global chlorine production trends in 2018-2023
Global production broken down by region, 2023
World production by country in 2023
World chlorine consumption trends in 2018-2023
Global consumption broken down by region, 2023
Consumption trends in Europe in 2018-2023
Consumption trends in Asia Pacific in 2018-2023
Consumption trends in North America in 2018-2023
Chlorine global trade in recent years
Europe prices dynamics
Asia Pacific prices dynamics
North America prices dynamics
Latin America prices dynamics
Each country market analysis features the following tables:
– Total chlorine capacity in Country, 2023
– Country: production in 2018-2023
– Country: consumption in 2018-2023
– Trade operations in Country
– Prices in Country
Global chlorine production forecast up to 2033
Planned chlorine capacity introductions
Global chlorine consumption forecast up to 2033
Europe: consumption forecast up to 2033
Asia Pacific: consumption forecast up to 2033
North America: consumption forecast up to 2033
Europe: chlorine prices forecast up to 2033
Asia Pacific: chlorine prices forecast up to 2033
North America: chlorine prices forecast up to 2033
Chlorine capacity broken down by region, 2023
Countries capacity shares in world total, 2023
Major chlorine producers in the world, 2023
Structure of global consumption, 2023
Each country market analysis features the following figures:
– Chlorine supply/demand in Country, 2018-2023
– Balance of chlorine trade in Country
Detailed analysis of chlorine (cl) market in a country is available covering data on capacity (by plant), production, consumption, trade, prices and market forecast.
Please select a country from the list below (if you do not find a market report you would be interested in, please contact a member of our team - [email protected]).
Ask a question or Order by email
More Reports
| Title | Date | Pages | Price |
|---|---|---|---|
| Apr, 2024 | 97 | US$ 4,500.00 | |
| Apr, 2024 | 115 | US$ 4,500.00 | |
| Apr, 2024 | 173 | US$ 4,500.00 | |
| Apr, 2024 | 105 | US$ 4,500.00 | |
| Apr, 2024 | 176 | US$ 4,500.00 |