Copper: 2024 World Market Review and Forecast to 2033
About Copper Market
- worldwide there are numerous copper end-uses which can be divided into some groups: electrical applications being the main ones (about 60%), followed by construction (24%), transport (8%) and others
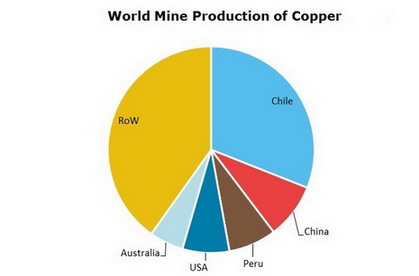
- most of the copper largest mines are located in Chile; the country accounts for 31% of global mine production
- global Cu industry is characterized by low prices and declining demand growth rates while production increase is observed
- China continues to be the largest copper consumer and situation in its local market influence the global Cu industry
- world copper market is expected to rebound but the oversupply will continue and pressure on the prices will go on
Copper Market Review is a source for detailed information on the market situation. The report contains descriptive and analytical parts, enriched with tables and figures for national and global markets. Market forecasts for the next ten years complete the report.
Scope
Geographically market report covers:
- World
- Countries
Timeframe of market report:
- Present situation
- Historical background
- Ten-year forecast
Global market analysis includes:
- Production and consumption
- Prices
- 10-year market forecast
- Downstream markets
A region/country market overview comprises:
- Production/consumption balance
- Export and import
- Manufacturers
Reasons to Buy
The immediate benefits of buying this report are as follows:
- Detailed statistics give clear picture of current market situation;
- Extensive price charts draw particular pricing trends in the recent years;
- Production/consumption charts backed with export/import tables outline country’s market position and value;
- Search for partners and suppliers is facilitated;
- Distinct market forecast aids the decision-making process.
*Please note that "Copper: 2024 World Market Review and Forecast" is a half ready publication and contents are subject to changes and additions. We have all data necessary for report preparation but it needs to be retrieved from our databases, organized in a report, updated with the latest information and thus the complete study will be presented. This process takes 4-5 business days after the order is placed. Thus, our clients always obtain a revised and updated version of each report. Please note that we do not charge for an updating procedure.
DISCLAIMER
RESEARCH METHODOLOGY
1. WORLD COPPER MARKET
1.1. Commodity overview
Description
Application spheres
Worldwide resources
Substitutes
1.2. Copper market in 2018-2023
Mine production
Refinery production
Major manufacturers’ profiles
Demand, consumption structure
1.3. Prices
2. EUROPEAN MARKET OF COPPER
Here and after a country market analysis covers the following (depending on market):
– mine production in 2018-2023
– refinery production in 2018-2023
– consumption in 2018-2023
– export and import of:
copper ores and concentrates
unrefined copper
refined cooper and unwrought alloys
2.1. Belgium
2.2. Bulgaria
2.3. Poland
2.4. Portugal
3. CIS COUNTRIES MARKET OF COPPER
3.1. Kazakhstan
3.2. Russia
3.3. Uzbekistan
4. ASIA PACIFIC MARKET OF COPPER
4.1. Australia
4.2. China
4.3. Indonesia
4.4. Mongolia
4.5. Philippines
5. NORTH AMERICAN MARKET OF COPPER
5.1. Canada
5.2. USA
6. LATIN AMERICAN MARKET OF COPPER
6.1. Argentina
6.2. Brazil
6.3. Chile
6.4. Mexico
6.5. Peru
7. MIDDLE EAST AND AFRICAN MARKET OF COPPER
7.1. Congo
7.2. Iran
7.3. South Africa
7.4. Turkey
7.5. Zambia
8. COPPER MARKET FORECAST TO 2033
8.1. Copper industry trends up to 2033
8.2. Supply forecast
8.3. Demand forecast, downstream sectors prospects
World reserves of copper in 2023
World mine production
World mine production by country
World refinery production
World refinery production by country
Copper supply/demand in Belgium market
Trade in Belgium
* Here and after volumes are provided for mine and refinery copper
** Depending on a country here and after export and import data are given for
copper ores and concentrates
unrefined copper
refined copper
Copper supply/demand in Bulgaria
Export and import in Bulgaria
Copper supply/demand in Poland
Trade in Poland
Supply/demand in Romania market
Trade in Romania
Metal supply/demand in Portugal
Trade in Portugal
Supply/demand in Portugal
Export and import in Portugal
Metal supply/demand in Kazakhstan market
Export and import in Kazakhstan
Metal supply/demand in Russia market
Export and import in Russia
Metal supply/demand in Uzbekistan
Trade in Uzbekistan
Metal supply/demand in Australia
Export and import in Australia
Copper supply/demand in China
Export and import in China
Copper supply/demand in Indonesia
Export and import in Indonesia
Copper supply/demand in Mongolia
Trade in Mongolia
Metal supply/demand in Philippines market
Export and import in Philippines
Copper supply/demand in Canada market
Export and import in Canada
Metal supply/demand in USA market
Export and import in USA
Metal supply/demand in Argentina
Trade in Argentina
Copper supply/demand in Brazil market
Export and import in Brazil
Copper supply/demand in Chile
Export and import in Chile
Copper supply/demand in Mexico market
Export and import in Mexico
Metal supply/demand in Peru
Trade in Peru
Copper supply/demand in Congo
Trade in Congo
Copper supply/demand in Iran
Trade in Iran
Copper supply/demand in South Africa
Trade in South Africa
Copper supply/demand in Turkey
Trade in Turkey
Copper supply/demand in Zambia
Trade in Zambia
Copper market forecast up to 2033
Detailed analysis of copper market in a country is available covering data on capacity (by plant), production, consumption, trade, prices and market forecast.
Please select a country from the list below (if you do not find a market report you would be interested in, please contact a member of our team - [email protected]).
Ask a question or Order by email
Copper Market Monitoring
For this report we offer a Monthly Update Service covering prices,
market news and companies activities.
More Reports
| Title | Date | Pages | Price |
|---|---|---|---|
| Apr, 2024 | 280 | US$ 3,300.00 | |
| Apr, 2024 | 58 | US$ 999.00 | |
| Apr, 2024 | 320 | US$ 3,300.00 |