Manganese: 2024 World Market Review and Forecast to 2033
About Manganese Market
- most of manganese produced globally is used in steelmaking (to improve steel strength and toughness or to remove unwanted elements)
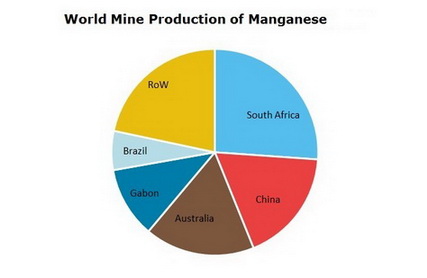
- South Africa accounts for a one quarter of world Mn supply; it is followed by China and Australia with almost equal shares
- due to slowering economy and decelerating steel industry (in China in particular) global manganese market demonstrates decreasing growth rates
- basing on estimations, flat growth is anticipated in the world manganese market
- overall market situation will depend on the prospects of steel industry which are looming
Manganese Market Review is a source for detailed information on the market situation. The report contains descriptive and analytical parts, enriched with tables and figures for national and global markets. Market forecasts for the next ten years complete the report.
Scope
Geographically manganese market report covers:
- World
- Countries
Timeframe of the market report:
- Present situation
- Historical background
- Ten-year forecast
Global manganese market analysis includes:
- Production and consumption
- Prices
- 10-year market forecast
- Projects
- Downstream markets
A region/country manganese market overview comprises:
- Production/consumption balance
- Export and import
- Manufacturers
Reasons to Buy
The immediate benefits of buying this report are as follows:
- Detailed statistics give clear picture of current market situation;
- Extensive price charts draw particular pricing trends in the recent years;
- Production/consumption charts backed with export/import tables outline country’s market position and value;
- Search for partners and suppliers is facilitated;
- Distinct market forecast aids the decision-making process.
*Please note that "Manganese: 2024 World Market Review and Forecast" is a half ready publication and contents are subject to changes and additions. We have all data necessary for report preparation but it needs to be retrieved from our databases, organized in a report, updated with the latest information and thus the complete study will be presented. This process takes 4-5 business days after the order is placed. Thus, our clients always obtain a revised and updated version of each report. Please note that we do not charge for an updating procedure.
DISCLAIMER
RESEARCH METHODOLOGY
1. WORLD MANGANESE MARKET
1.1. Commodity overview
manganese application spheres
manganese worldwide resources
manganese substitutes
1.2. Manganese world market in 2018-2023
manganese ore production globally and by country
ferromanganese and silicomanganese production globally and by country
manganese demand (metal content), consumption structure
2. EUROPEAN MARKET OF MANGANESE
2.1. France manganese market in 2018-2023
ferromanganese and silicomanganese production
manganese demand (metal content)
trade of manganese ores and concentrates, ferro-manganese, ferro-silico-manganese
manganese prices
2.2. Norway manganese market in 2018-2023
ferromanganese and silicomanganese production
manganese demand (metal content)
trade of manganese ores and concentrates, ferro-manganese, ferro-silico-manganese
manganese prices
2.3. Spain manganese market in 2018-2023
ferromanganese and silicomanganese production
manganese demand (metal content)
trade of manganese ores and concentrates, ferro-manganese, ferro-silico-manganese
manganese prices
3. CIS COUNTRIES MARKET OF MANGANESE
3.1. Georgia manganese market in 2018-2023
ferromanganese and silicomanganese production
manganese demand (metal content)
trade of manganese ores and concentrates, ferro-manganese, ferro-silico-manganese
manganese prices
3.2. Kazakhstan manganese market in 2018-2023
manganese ore production
ferromanganese and silicomanganese production
manganese demand (metal content)
trade of manganese ores and concentrates, ferro-manganese, ferro-silico-manganese
manganese prices
3.3. Russia manganese market in 2018-2023
ferromanganese and silicomanganese production
manganese demand (metal content)
trade of manganese ores and concentrates, ferro-manganese, ferro-silico-manganese
manganese prices
3.4. Ukraine manganese market in 2018-2023
ferromanganese and silicomanganese production
manganese demand (metal content)
trade of manganese ores and concentrates, ferro-manganese, ferro-silico-manganese
manganese prices
4. ASIA PACIFIC MARKET OF MANGANESE
4.1. Australia manganese market in 2018-2023
manganese ore production
ferromanganese and silicomanganese production
manganese demand (metal content)
trade of manganese ores and concentrates, ferro-manganese, ferro-silico-manganese
manganese prices
4.2. China manganese market in 2018-2023
manganese ore production
ferromanganese and silicomanganese production
manganese demand (metal content)
trade of manganese ores and concentrates, ferro-manganese, ferro-silico-manganese
manganese prices
4.3. India manganese market in 2018-2023
manganese ore production
ferromanganese and silicomanganese production
manganese demand (metal content)
trade of manganese ores and concentrates, ferro-manganese, ferro-silico-manganese
manganese prices
4.4. Japan manganese market in 2018-2023
ferromanganese and silicomanganese production
manganese demand (metal content)
trade of manganese ores and concentrates, ferro-manganese, ferro-silico-manganese
manganese prices
4.5. Malaysia manganese market in 2018-2023
manganese ore production
ferromanganese and silicomanganese production
manganese demand (metal content)
trade of manganese ores and concentrates, ferro-manganese, ferro-silico-manganese
manganese prices
4.6. South Korea manganese market in 2018-2023
ferromanganese and silicomanganese production
manganese demand (metal content)
trade of manganese ores and concentrates, ferro-manganese, ferro-silico-manganese
manganese prices
5. NORTH AMERICAN MARKET OF MANGANESE
5.1. USA manganese market in 2018-2023
ferromanganese and silicomanganese production
manganese demand (metal content)
trade of manganese ores and concentrates, ferro-manganese, ferro-silico-manganese
manganese prices
6. LATIN AMERICAN MARKET OF MANGANESE
6.1. Brazil manganese market in 2018-2023
manganese ore production
ferromanganese and silicomanganese production
manganese demand (metal content)
trade of manganese ores and concentrates, ferro-manganese, ferro-silico-manganese
manganese prices
6.2. Mexico manganese market in 2018-2023
manganese ore production
ferromanganese and silicomanganese production
manganese demand (metal content)
trade of manganese ores and concentrates, ferro-manganese, ferro-silico-manganese
manganese prices
7. AFRICAN MARKET OF MANGANESE
7.1. Gabon manganese market in 2018-2023
manganese ore production
trade of manganese ores and concentrates
manganese prices
7.2. South Africa manganese market in 2018-2023
manganese ore production
ferromanganese and silicomanganese production
manganese demand (metal content)
trade of manganese ores and concentrates, ferro-manganese, ferro-silico-manganese
manganese prices
8. MANGANESE MARKET FORECAST TO 2033
8.1. World manganese market trends up to 2033
8.2. Manganese supply forecast to 2033: volumes and dynamics
8.3. World manganese demand forecast to 2033: volumes and dynamics
9. MANGANESE DOWNSTREAM MARKETS TRENDS AND PROSPECTS
World reserves of manganese as of 2023
Global manganese ore production in 2018-2023
World ferromanganese and silicomanganese production in 2018-2023
Ferromanganese and silicomanganese production by country
Manganese supply/demand in France in 2018-2023
Trade of:
manganese ores and concentrates
ferro-manganese
ferro-silico-manganese
Prices
Manganese supply/demand in Norway in 2018-2023
Trade of:
manganese ores and concentrates
ferro-manganese
ferro-silico-manganese
Prices
Manganese supply/demand in Spain in 2018-2023
Trade of:
manganese ores and concentrates
ferro-manganese
ferro-silico-manganese
Prices
Manganese supply/demand in Georgia in 2018-2023
Trade of:
manganese ores and concentrates
ferro-manganese
ferro-silico-manganese
Prices
Manganese supply/demand in Kazakhstan in 2018-2023
Manganese ore production in Kazakhstan in 2018-2023
Trade of:
manganese ores and concentrates
ferro-manganese
ferro-silico-manganese
Prices
Manganese supply/demand in Russia in 2018-2023
Trade of:
manganese ores and concentrates
ferro-manganese
ferro-silico-manganese
Prices
Manganese supply/demand in Ukraine in 2018-2023
Trade of:
manganese ores and concentrates
ferro-manganese
ferro-silico-manganese
Prices
Manganese supply/demand in Australia in 2018-2023
Manganese ore production in Australia in 2018-2023
Trade of:
manganese ores and concentrates
ferro-manganese
ferro-silico-manganese
prices
Manganese supply/demand in China in 2018-2023
Manganese ore production in China in 2018-2023
Trade of:
manganese ores and concentrates
ferro-manganese
ferro-silico-manganese
Prices
Manganese supply/demand in India in 2018-2023
Manganese ore production in India in 2018-2023
Trade of:
manganese ores and concentrates
ferro-manganese
ferro-silico-manganese
Prices
Manganese supply/demand in Japan in 2018-2023
Trade of:
manganese ores and concentrates
Trade of ferro-manganese
Trade of ferro-silico-manganese
Prices
Manganese supply/demand in Malaysia in 2018-2023
Manganese ore production in Malaysia in 2018-2023
Trade of:
manganese ores and concentrates
ferro-manganese
ferro-silico-manganese
Prices
Manganese supply/demand in South Korea in 2018-2023
Trade of:
manganese ores and concentrates
ferro-manganese
ferro-silico-manganese
Prices
Manganese supply/demand in USA in 2018-2023
Trade of:
manganese ores and concentrates
ferro-manganese
ferro-silico-manganese
Prices
Manganese supply/demand in Brazil in 2018-2023
Manganese ore production in Brazil in 2018-2023
Trade of:
manganese ores and concentrates
ferro-manganese
ferro-silico-manganese
Prices
Manganese supply/demand in Mexico in 2018-2023
Manganese ore production in Mexico in 2018-2023
Trade of:
manganese ores and concentrates
ferro-manganese
ferro-silico-manganese
Prices
Manganese ore production in Gabon in 2018-2023
Trade of manganese ores and concentrates in Gabon
Prices
Manganese supply/demand in South Africa in 2018-2023
Manganese ore production in South Africa in 2018-2023
Trade of:
manganese ores and concentrates
ferro-manganese
ferro-silico-manganese
Prices
Detailed analysis of manganese market in a country is available covering data on capacity (by plant), production, consumption, trade, prices and market forecast.
Please select a country from the list below (if you do not find a market report you would be interested in, please contact a member of our team - [email protected]).
Ask a question or Order by email
More Reports
| Title | Date | Pages | Price |
|---|---|---|---|
| Apr, 2024 | 140 | US$ 3,300.00 |