Talc: 2026 World Market Review and Forecast to 2035
About Talc Market
- the main application spheres of talc are ceramics, paint, paper, etc.
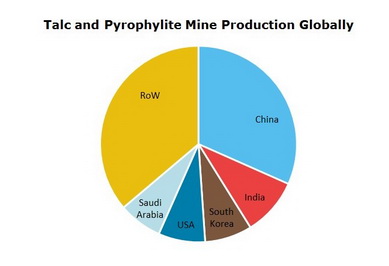
- China is the world leading manufacturer of talc, followed by India and USA; some high quality, special grades are supplied mainly by China and Australia
- emerging countries show higher demand increase than developed ones
- world talc market growth will be driven by the plastics industry; besides demand from coatings, food processing and ceramics markets will grow
Talc Market Review is a source for detailed information on the market situation. The report contains descriptive and analytical parts, enriched with tables and figures for national and global markets. Market forecasts for the next ten years complete the report.
Scope
Geographically the market report covers:
- World
- Countries
Timeframe of the market report:
- Present situation
- Historical background
- Ten-year forecast
Global market analysis includes:
- Production and consumption
- Prices
- 10-year market forecast
- Downstream markets
A region/country talc market overview comprises:
- Production/consumption balance
- Export and import
- Manufacturers
Reasons to Buy
The immediate benefits of buying this report are as follows:
- Detailed statistics give clear picture of current market situation;
- Extensive price charts draw particular pricing trends in the recent years;
- Production/consumption charts backed with export/import tables outline country’s market position and value;
- Search for partners and suppliers is facilitated;
- Distinct market forecast aids the decision-making process.
*Please note that "Talc: 2026 World Market Review and Forecast" is a half ready publication and contents are subject to changes and additions. We have all data necessary for report preparation but it needs to be retrieved from our databases, organized in a report, updated with the latest information and thus the complete study will be presented. This process takes 4-5 business days after the order is placed. Thus, our clients always obtain a revised and updated version of each report. Please note that we do not charge for an updating procedure.
DISCLAIMER
RESEARCH METHODOLOGY
1. WORLD TALC MARKET
1.1. Commodity overview
Description
Application spheres
Worldwide resources
Substitutes
1.2. Talc market in 2020-2025
Mine production
Major manufacturers’ profiles
Demand, consumption structure
1.3. Talc prices
2. EUROPEAN MARKET OF TALC
Here and after a country talc market analysis covers the following (depending on market):
– mine production in 2020-2025
– consumption in 2020-2025
– export and import of natural steatite (not crushed and not powdered or crushed and powdered)
2.1. Austria
2.2. Italy
2.3. Finland
2.4. France
3. CIS COUNTRIES MARKET OF TALC
3.1. Russia
4. ASIA PACIFIC MARKET OF TALC
4.1. Australia
4.2. China
4.3. India
4.4. Japan
4.5. Pakistan
4.6. South Korea
4.7. Thailand
5. NORTH AMERICAN MARKET OF TALC
5.1. Canada
5.2. USA
6. LATIN AMERICAN MARKET OF TALC
6.1. Argentina
6.2. Brazil
7. MIDDLE EAST AND AFRICAN MARKET OF TALC
7.1. South Africa
7.2. Turkey
8. TALC MARKET FORECAST TO 2035
8.1. Talc market trends up to 2035
8.2. Supply forecast
8.3. Demand forecast, downstream markets prospects
World reserves of talc, 2025
World mine production
World mine production by country
Talc supply/demand in Austria
Trade of natural steatite in Austria
Talc supply/demand in Italy
Trade of natural steatite in Italy
Talc supply/demand in Finland
Trade of natural steatite in Finland
Talc supply/demand in France
Trade of natural steatite in France
Talc supply/demand in Russia
Trade of natural steatite in Russia
Talc supply/demand in Australia
Trade of natural steatite in Australia
Talc supply/demand in China
Trade of natural steatite in China
Talc supply/demand in India
Trade of natural steatite in India
Talc supply/demand in Japan
Trade of natural steatite in Japan
Talc supply/demand in Pakistan
Trade of natural steatite in Pakistan
Talc supply/demand in South Korea
Trade of natural steatite in South Korea
Talc supply/demand in Thailand
Trade of natural steatite in Thailand
Talc supply/demand in Turkey
Trade of natural steatite in Turkey
Talc supply/demand in Canada
Trade of natural steatite in Canada
Talc supply/demand in USA
Trade of natural steatite in USA
Talc supply/demand in Argentina
Trade of natural steatite in Argentina
Talc supply/demand in Brazil
Trade of natural steatite in Brazil
Talc supply/demand in South Africa
Trade of natural steatite in South Africa
Talc market forecast up to 2035
Ask a question or Order by email
More Reports
| Title | Date | Pages | Price |
|---|---|---|---|
| Jun, 2026 | 135 | US$ 3,300.00 | |
| Jun, 2026 | 140 | US$ 999.00 | |
| Jun, 2026 | 114 | US$ 3,300.00 |