Aluminium: 2026 World Market Review and Forecast to 2035
About Aluminium Market
- bauxite is the principal ore for aluminium production (about 90%); Australia is the largest bauxite producer in global market with 35% share
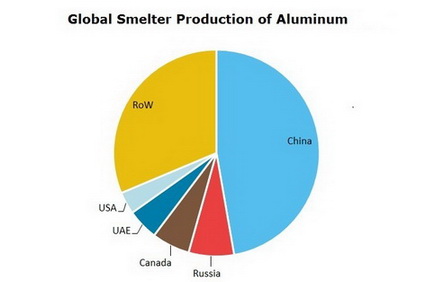
- China is the main consumer of the primary aluminium; Europe and North America are also the key consuming regions
- aluminium demand depends on the state of numerous downstream industries including aerospace, construction automotive, etc.
- as downstream markets are foreseen to increase usage of aluminium, there are expectations about world aluminium demand healthy growth and prices rebound
Aluminium Market Review is a source for detailed information on the ore and metal market situation. The report contains descriptive and analytical parts, enriched with tables and figures for national and global markets. Market forecasts for the next ten years complete the report.
Scope
Geographically aluminium market report covers:
- World
- Coliuntries
Timeframe of aluminium market report:
- Present situation
- Historical background
- Ten-year forecast
Global aluminium market analysis includes:
- Capacity
- Production and consumption
- Prices
- 10-year market forecast
- Projects
- Downstream markets
A region/country aluminium market overview comprises:
- Production/consumption balance
- Export and import
- Manufacturers
Reasons to Buy
The immediate benefits of buying this report are as follows:
- Detailed statistics give clear picture of current market situation;
- Extensive price charts draw particular pricing trends in the recent years;
- Production/consumption charts backed with export/import tables outline country’s market position and value;
- Search for partners and suppliers is facilitated;
- Distinct market forecast aids the decision-making process.
*Please note that "Aluminium: 2026 World Market Review and Forecast to 2035" is a half ready publication and contents are subject to changes and additions. We have all data necessary for report preparation but it needs to be retrieved from our databases, organized in a report, updated with the latest information and thus the complete study will be presented. This process takes 4-5 business days after the order is placed. Thus, our clients always obtain a revised and updated version of each report. Please note that we do not charge for an updating procedure.
DISCLAIMER
RESEARCH METHODOLOGY
1. WORLD ALUMINIUM INDUSTRY
1.1. Commodity overview
Description
Application spheres
Substitutes
1.2. Global aluminium supply in 2020-2025
Global bauxite reserves
World aluminium production in 2020-2025: structure and dynamics
1.3. Global aluminium demand in 2020-2025: structure and dynamics
1.4. Aluminium prices in global market
2. EUROPEAN MARKET OF ALUMINIUM
2.1. France
Aluminium supply and demand in France in 2020-2025
Trade in France in recent years: volume and value, structure by partner country
2.2. Germany
Aluminium supply and demand in Germany in 2020-2025
Trade in Germany in recent years: volume and value, structure by partner country
2.3. Greece
Aluminium supply and demand in Greece in 2020-2025
Trade in Greece in recent years: volume and value, structure by partner country
2.4. Iceland
Aluminium supply and demand in Iceland in 2020-2025
Trade in Iceland in recent years: volume and value, structure by partner country
2.5. Netherlands
Aluminium supply and demand in Netherlands in 2020-2025
Trade in Netherlands in recent years: volume and value, structure by partner country
2.6. Norway
Aluminium supply and demand in Norway in 2020-2025
Trade in Norway in recent years: volume and value, structure by partner country
2.7. Spain
Aluminium supply and demand in Spain in 2020-2025
Trade in Spain in recent years: volume and value, structure by partner country
2.8. Sweden
Aluminium supply and demand in Sweden in 2020-2025
Trade in Sweden in recent years: volume and value, structure by partner country
3. CIS MARKET OF ALUMINIUM
3.1. Azerbaijan
Aluminium supply and demand in Azerbaijan in 2020-2025
Trade in Azerbaijan in recent years: volume and value, structure by partner country
3.2. Kazakhstan
Aluminium supply and demand in Kazakhstan in 2020-2025
Trade in Kazakhstan in recent years: volume and value, structure by partner country
3.3. Russia
Aluminium supply and demand in Russia in 2020-2025
Trade in Russia in recent years: volume and value, structure by partner country
3.4. Tajikistan
Aluminium supply and demand in Tajikistan in 2020-2025
Trade in Tajikistan in recent years: volume and value, structure by partner country
4. ASIA PACIFIC MARKET OF ALUMINIUM
4.1. Australia
Aluminium supply and demand in Australia in 2020-2025
Trade in Australia in recent years: volume and value, structure by partner country
4.2. China
Aluminium supply and demand in China in 2020-2025
Trade in China in recent years: volume and value, structure by partner country
4.3. India
Aluminium supply and demand in India in 2020-2025
Trade in India in recent years: volume and value, structure by partner country
4.4. Indonesia
Aluminium supply and demand in Indonesia in 2020-2025
Trade in Indonesia in recent years: volume and value, structure by partner country
4.5. New Zealand
Aluminium supply and demand in New Zealand in 2020-2025
Trade in New Zealand in recent years: volume and value, structure by partner country
5. NORTH AMERICA MARKET OF ALUMINIUM
5.1. Canada
Aluminium supply and demand in Canada in 2020-2025
Trade in Canada in recent years: volume and value, structure by partner country
5.2. USA
Aluminium supply and demand in USA in 2020-2025
Trade in USA in recent years: volume and value, structure by partner country
6. LATIN AMERICA MARKET OF ALUMINIUM
6.1. Argentina
Aluminium supply and demand in Argentina in 2020-2025
Trade in Argentina in recent years: volume and value, structure by partner country
6.2. Brazil
Aluminium supply and demand in Brazil in 2020-2025
Trade in Brazil in recent years: volume and value, structure by partner country
7. MIDDLE EAST AND AFRICA MARKET OF ALUMINIUM
7.1. Bahrain
Aluminium supply and demand in Bahrain in 2020-2025
Trade in Bahrain in recent years: volume and value, structure by partner country
7.2. Egypt
Aluminium supply and demand in Egypt in 2020-2025
Trade in Egypt in recent years: volume and value, structure by partner country
7.3. Mozambique
Aluminium supply and demand in Mozambique in 2020-2025
Trade in Mozambique in recent years: volume and value, structure by partner country
7.4. Oman
Aluminium supply and demand in Oman in 2020-2025
Trade in Oman in recent years: volume and value, structure by partner country
7.5. South Africa
Aluminium supply and demand in South Africa in 2020-2025
Trade in South Africa in recent years: volume and value, structure by partner country
7.6. Saudi Arabia
Aluminium supply and demand in Saudi Arabia in 2020-2025
Trade in Saudi Arabia in recent years: volume and value, structure by partner country
7.7. Qatar
Aluminium supply and demand in Qatar in 2020-2025
Trade in Qatar in recent years: volume and value, structure by partner country
7.8. Turkey
Aluminium supply and demand in Turkey in 2020-2025
Trade in Turkey in recent years: volume and value, structure by partner country
7.9. UAE
Aluminium supply and demand in UAE in 2020-2025
Trade in UAE in recent years: volume and value, structure by partner country
8. GLOBAL ALUMINIUM MARKET FORECAST TO 2035
8.1. Global aluminium market trends up to 2035
8.2. Aluminium supply forecast to 2035, projects
8.3. Aluminium demand forecast to 2035
8.4. Aluminium prices forecast to 2035
Ask a question or Order by email
Aluminium Market Monitoring
For this report we offer a Monthly Update Service covering prices,
market news and companies activities.
More Reports
| Title | Date | Pages | Price |
|---|---|---|---|
| Jun, 2026 | 280 | US$ 3,300.00 | |
| Jun, 2026 | 279 | US$ 3,300.00 | |
| Jun, 2026 | 58 | US$ 999.00 | |
| Jun, 2026 | 424 | US$ 3,499.00 |