Bismuth: 2024 World Market Review and Forecast to 2033
About Bismuth Market
- major part of bismuth is produced as a byproduct of mining and processing of other metals ores
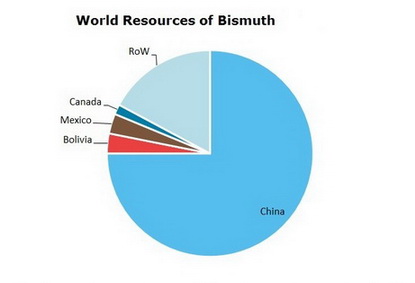
- China possesses the largest reserves of bismuth and is the main manufacturer in the global market
- bismuth is mainly used in alloys, pharmaceuticals and chemicals
- global bismuth demand will continue to increase; China will remain the leading producer and supplier of bismuth in the global market
- as a nontoxic metal, bismuth is expected to gain the market; e.g. bismuth is supposed to replace lead in many applications in the electronics industry
- new applications such as in superconductive material, catalysts, nucleus fuel, and others are expected to support good demand for metal
Bismuth Market Review is a source for detailed information on the market situation. The report contains descriptive and analytical parts, enriched with tables and figures for national and global markets. Market forecasts for the next ten years complete the report.
Scope
Geographically market report covers:
- World
- Countries
Timeframe of market report:
- Present situation
- Historical background
- Ten-year forecast
Global bismuth market analysis includes:
- Production and consumption
- Prices
- 10-year market forecast
- Downstream markets
A region/country bismuth market overview comprises:
- Production/consumption balance
- Export and import
- Manufacturers
Reasons to Buy
The immediate benefits of buying this report are as follows:
- Detailed statistics give clear picture of current market situation;
- Extensive price charts draw particular pricing trends in the recent years;
- Production/consumption charts backed with export/import tables outline country’s market position and value;
- Search for partners and suppliers is facilitated;
- Distinct market forecast aids the decision-making process.
*Please note that "Bismuth: 2024 World Market Review and Forecast" is a half ready publication and contents are subject to changes and additions. We have all data necessary for report preparation but it needs to be retrieved from our databases, organized in a report, updated with the latest information and thus the complete study will be presented. This process takes 4-5 business days after the order is placed. Thus, our clients always obtain a revised and updated version of each report. Please note that we do not charge for an updating procedure.
DISCLAIMER
RESEARCH METHODOLOGY
1. WORLD BISMUTH INDUSTRY
1.1. Commodity overview
Description
Application spheres
Worldwide resources
Substitutes
1.2. Bismuth industry in 2018-2023
Refinery production
Major manufacturers’ profiles
Demand, consumption structure
Bismuth as replacement for lead
1.3. Prices
2. CIS COUNTRIES MARKET OF BISMUTH
Here and after a country market analysis covers the following (depending on market):
– refinery production in 2018-2023
– consumption in 2018-2023
– export and import of bismuth and articles thereof, incl. waste & scrap
2.1. Russia
2.2. Kazakhstan
3. ASIAN MARKET OF BISMUTH
3.1. China
3.2. Laos
4. NORTH AMERICA
4.1. Canada
4.2. USA
5. LATIN AMERICA
5.1. Mexico
6. BISMUTH MARKET FORECAST TO 2033
6.1. Market trends up to 2033
6.2. Supply forecast up to 2033
6.3. Demand forecast, downstream markets prospects
World reserves in 2023
World refinery production
Refinery production by country
Commodity supply/demand in Russia
Trade of bismuth and articles thereof in Russia
Commodity supply/demand in Kazakhstan
Trade of bismuth and articles thereof in Kazakhstan
Supply/demand in China
Trade of bismuth and articles thereof in China
Demand in USA
Trade of bismuth and articles thereof in USA
Supply/demand in Canada
Trade of bismuth and articles thereof in Canada
Supply/demand in Bolivia
Trade of bismuth and articles thereof in Bolivia
Supply/demand in Mexico
Trade of bismuth and articles thereof in Mexico
Market forecast up to 2033
Ask a question or Order by email
More Reports
| Title | Date | Pages | Price |
|---|---|---|---|
| Apr, 2024 | 58 | US$ 999.00 | |
| Apr, 2024 | 105 | US$ 3,300.00 | |
| Apr, 2024 | 279 | US$ 3,300.00 | |
| Apr, 2024 | 300 | US$ 3,300.00 | |
| Apr, 2024 | 320 | US$ 3,300.00 |