Molybdenum: 2024 World Market Review and Forecast to 2033
About Molybdenum Market
- molybdenum (moly) is mainly used in high-strength alloys production; iron and steel industry is the main consumer
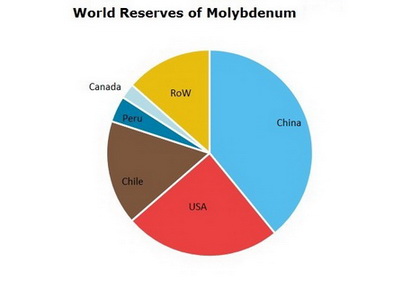
- China is the largest molybdenum producer, accounting for about 37% of global output; China, USA and Chile own large molybdenum deposits
- about half of global moly output is from recycling (by-product of mining copper) and the share is projected to increase
- world existing resources are enough to meet the demand across the globe for a quite long period of time
- world moly production and demand are foreseen to show moderate growth rates
Molybdenum Market Review is a source for detailed information on the market situation. The report contains descriptive and analytical parts, enriched with tables and figures for national and global markets. Market forecasts for the next ten years complete the report.
Scope
Geographically the market report covers:
- World
- Countries
Timeframe of the market report:
- Present situation
- Historical background
- Ten-year forecast
Global molybdenum market analysis includes:
- Production and consumption
- Prices
- 10-year market forecast
- Projects
- Downstream markets
A region/country molybdenum market overview comprises:
- Production/consumption balance
- Export and import
- Manufacturers
Reasons to Buy
The immediate benefits of buying this report are as follows:
- Detailed statistics give clear picture of current market situation;
- Extensive price charts draw particular pricing trends in the recent years;
- Production/consumption charts backed with export/import tables outline country’s market position and value;
- Search for partners and suppliers is facilitated;
- Distinct market forecast aids the decision-making process.
*Please note that "Molybdenum: 2024 World Market Review and Forecast" is a half ready publication and contents are subject to changes and additions. We have all data necessary for report preparation but it needs to be retrieved from our databases, organized in a report, updated with the latest information and thus the complete study will be presented. This process takes 4-5 business days after the order is placed. Thus, our clients always obtain a revised and updated version of each report. Please note that we do not charge for an updating procedure.
DISCLAIMER
RESEARCH METHODOLOGY
1. WORLD MOLYBDENUM MARKET
1.1. Commodity overview
Description
Application spheres
Worldwide resources
Substitutes
1.2. Molybdenum market in 2018-2023
Mine production
Major manufacturers’ profiles
Demand, consumption structure
1.3. Prices
2. CIS COUNTRIES MARKET
Here and after a country market analysis covers the following (depending on market):
– mine production in 2018-2023
– consumption in 2018-2023
– export and import of:
molybdenum ores and concentrates
molybdenum oxides and hydroxides
ferromolybdenum
molybdenum powders
2.1. Armenia
2.2. Russia
2.3. Uzbekistan
3. ASIA PACIFIC MARKET
3.1. China
3.2. Mongolia
4. NORTH AMERICAN MARKET
4.1. Canada
4.2. USA
5. LATIN AMERICAN MARKET
5.1. Chile
5.2. Mexico
5.3. Peru
6. MIDDLE EAST MARKET
6.1. Iran
6.2. Turkey
7. MOLYBDENUM MARKET FORECAST TO 2033
7.1. Market trends up to 2033
7.2. Supply forecast, projects
7.3. Demand forecast, downstream markets perspectives
World reserves in 2023
World mine production
World mine production by country
Commodity supply/demand in Armenia
Trade of molybdenum ores and concentrates/ferromolybdenum in Armenia
Commodity supply/demand in Russia
Trade of molybdenum ores and concentrates/ molybdenum oxides and hydroxides in Russia
Trade of ferromolybdenum/molybdenum powders in Russia
Commodity supply/demand in Uzbekistan
Trade of ores and concentrates in Uzbekistan
Trade of molybdenum oxides and hydroxides in Uzbekistan
Commodity supply/demand in China
Trade of ores and concentrates/ molybdenum oxides and hydroxides in China
Trade of ferromolybdenum/molybdenum powders in China
Commodity supply/demand in Mongolia
Trade of molybdenum ores and concentrates in Mongolia
Commodity supply/demand in Canada
Trade of ores and concentrates/molybdenum oxides and hydroxides in Canada
Trade of ferromolybdenum in Canada
Commodity supply/demand in USA
Trade of molybdenum ores and concentrates/molybdenum oxides and hydroxides in USA
Trade of ferromolybdenum/molybdenum powders in USA
Commodity supply/demand in Chile
Trade of molybdenum ores and concentrates/molybdenum oxides and hydroxides in Chile
Trade of ferromolybdenum in Chile
Commodity supply/demand in Mexico
Trade of molybdenum ores and concentrates/molybdenum oxides and hydroxides in Mexico
Trade of ferromolybdenum in Mexico
Commodity supply/demand in Peru
Trade of molybdenum ores and concentrates in Peru
Trade of ferromolybdenum in Peru
Commodity supply/demand in Iran
Trade of molybdenum ores and concentrates in Iran
Commodity supply/demand in Turkey
Trade of molybdenum oxides and hydroxides in Turkey
Trade of ferromolybdenum in Turkey
Market forecast up to 2033
Detailed analysis of molybdenum market in a country is available covering data on capacity (by plant), production, consumption, trade, prices and market forecast.
Please select a country from the list below (if you do not find a market report you would be interested in, please contact a member of our team - [email protected]).
Ask a question or Order by email
More Reports
| Title | Date | Pages | Price |
|---|---|---|---|
| Dec, 2024 | 336 | US$ 3,300.00 | |
| Dec, 2024 | 80 | US$ 2,300.00 | |
| Dec, 2024 | 170 | US$ 3,300.00 | |
| Dec, 2024 | 150 | US$ 3,300.00 | |
| Dec, 2024 | 30 | US$ 1,050.00 | |
| Dec, 2024 | 30 | US$ 1,050.00 | |
| Dec, 2024 | 30 | US$ 1,050.00 | |
| Dec, 2024 | 30 | US$ 1,050.00 | |
| Dec, 2024 | 30 | US$ 1,050.00 | |
| Dec, 2024 | 30 | US$ 1,050.00 | |
| Dec, 2024 | 30 | US$ 1,050.00 | |
| Dec, 2024 | 30 | US$ 1,050.00 | |
| Dec, 2024 | 30 | US$ 1,050.00 |