Phosphate Rock: 2024 World Market Review and Forecast to 2033
About Phosphate Rock Market
- the most of phosphate rock is applied in the production of phosphoric acid further used in fertilizer and animal feed supplements industries
- production and demand of phosphate rock has been on a rise recently
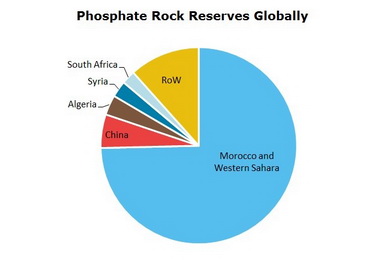
- the area of Morocco and Western Sahara can boast of the largest phosphate rock reserves – 75% of world total; China is the main manufacturer – close to 50% of world total
- global market is foreseen to grow and new capacities are planned and being built
- Asia Pacific and Latin America will demonstrate the highest growth rates
Phosphate Rock Market Review is a source for detailed information on the market situation. The report contains descriptive and analytical parts, enriched with tables and figures for national and global markets. Market forecasts for the next ten years complete the report.
Scope
- Geographically the market report covers:
- World
- Countries
Timeframe of the market report:
- Present situation
- Historical background
- Ten-year forecast
Global market analysis includes:
- Production and consumption
- Prices
- 10-year market forecast
- Projects
- Downstream markets
A region/country market overview comprises:
- Production/consumption balance
- Export and import
- Manufacturers
Reasons to Buy
The immediate benefits of buying this report are as follows:
- Detailed statistics give clear picture of current market situation;
- Extensive price charts draw particular pricing trends in the recent years;
- Production/consumption charts backed with export/import tables outline country’s market position and value;
- Search for partners and suppliers is facilitated;
- Distinct market forecast aids the decision-making process.
*Please note that "Phosphate Rock: 2024 World Market Review and Forecast" is a half ready publication and contents are subject to changes and additions. We have all data necessary for report preparation but it needs to be retrieved from our databases, organized in a report, updated with the latest information and thus the complete study will be presented. This process takes 4-5 business days after the order is placed. Thus, our clients always obtain a revised and updated version of each report. Please note that we do not charge for an updating procedure.
DISCLAIMER
RESEARCH METHODOLOGY
1. WORLD PHOSPHATE ROCK MARKET
1.1. Commodity overview
Description
Application spheres
Worldwide resources
1.2. Phosphate rock market in 2018-2023
Mine production
Demand, consumption structure
2. EUROPEAN MARKET OF PHOSPHATE ROCK
Here and after a country market analysis covers the following (depending on market):
– mine production in 2018-2023
– consumption in 2018-2023
– export and import of ground and unground phosphates
2.1. Finland
3. CIS COUNTRIES MARKET OF PHOSPHATE ROCK
3.1. Kazakhstan
3.2. Russia
4. ASIA PACIFIC MARKET OF PHOSPHATE ROCK
4.1. Australia
4.2. China
4.3. India
5. NORTH AMERICAN MARKET OF PHOSPHATE ROCK
5.1. USA
6. LATIN AMERICAN MARKET OF PHOSPHATE ROCK
6.1. Brazil
6.2. Mexico
6.3. Peru
7. MIDDLE EAST AND AFRICAN MARKET OF PHOSPHATE ROCK
7.1. Algeria
7.2. Egypt
7.3. Israel
7.4. Jordan
7.5. Morocco
7.6. Saudi Arabia
7.7. South Africa
7.8. Tunisia
8. PHOSPHATE ROCK MARKET FORECAST TO 2033
8.1. Market trends up to 2033
8.2. Supply forecast, projects
8.3. Demand forecast, downstream markets prospects
World reserves of phosphate rock, 2023
World mine production
World mine production by country
Phosphate rock supply/demand in Finland
Trade of unground/ground phosphates in Finland
Production/consumption in Kazakhstan
Trade of unground/ground phosphates in Kazakhstan
Production/consumption in Russia
Trade of unground/ground phosphates in Russia
Production/consumption in Australia
Trade of unground/ground phosphates in Australia
Production/consumption in China
Trade of unground/ground phosphates in China
Production/consumption in India
Trade of unground/ground phosphates in India
Production/consumption in USA
Trade of unground/ground phosphates in USA
Production/consumption in Brazil
Trade of unground/ground phosphates in Brazil
Production/consumption in Mexico
Trade of unground/ground phosphates in Mexico
Production/consumption in Peru
Trade of unground/ground phosphates in Peru
Production/consumption in Algeria
Trade in Algeria
Production/consumption in Egypt
Trade in Egypt
Production/consumption in Israel
Trade in Israel
Production/consumption in Jordan
Trade in Jordan
Production/consumption in Morocco
Trade in Morocco
Production/consumption in Saudi Arabia
Trade in Saudi Arabia
Production/consumption in South Africa
Trade of unground/ground phosphates in South Africa
Production/consumption in Tunisia
Trade of unground/ground phosphates in Tunisia
Phosphate rock market forecast up to 2033
Detailed analysis of phosphate rock market in a country is available covering data on capacity (by plant), production, consumption, trade, prices and market forecast.
Please select a country from the list below (if you do not find a market report you would be interested in, please contact a member of our team - [email protected]).
Ask a question or Order by email
More Reports
| Title | Date | Pages | Price |
|---|---|---|---|
| Apr, 2024 | 62 | US$ 1,899.00 |