Salt: 2025 World Market Review and Forecast to 2034
About Salt Market
- about 2/3 of salt is consumed by chemical industry (chlor alkali, soda ash, etc.), road de-icing and food sectors come next
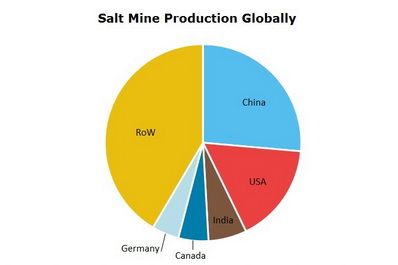
- the leading salt producing country is China
- global salt market will grow; chemicals production will continue to dominate in consumption structure and its share will increase to 70%
- as a result of unstable winters demand from road de-icing sector will vary from year to year while its share will be decreasing; food and food processing sector will keep on at good growth rates
- Asia Pacific will keep the position of the largest salt consumer and demonstrate the highest growth rates
Salt Market Review is a source for detailed information on the market situation. The report contains descriptive and analytical parts, enriched with tables and figures for national and global markets. Market forecasts for the next ten years complete the report.
Scope
Geographically salt market report covers:
- World
- Countries
Timeframe of salt market report:
- Present situation
- Historical background
- Ten-year forecast
Global salt market analysis includes:
- Production and consumption
- Prices
- 10-year market forecast
- Downstream markets
A region/country salt market overview comprises:
- Production/consumption balance
- Export and import
- Manufacturers
Reasons to Buy
The immediate benefits of buying this report are as follows:
- Detailed statistics give clear picture of current market situation;
- Extensive price charts draw particular pricing trends in the recent years;
- Production/consumption charts backed with export/import tables outline country’s market position and value;
- Search for partners and suppliers is facilitated;
- Distinct market forecast aids the decision-making process.
*Please note that "Salt: 2025 World Market Review and Forecast" is a half ready publication and contents are subject to changes and additions. We have all data necessary for report preparation but it needs to be retrieved from our databases, organized in a report, updated with the latest information and thus the complete study will be presented. This process takes 4-5 business days after the order is placed. Thus, our clients always obtain a revised and updated version of each report. Please note that we do not charge for an updating procedure.
DISCLAIMER
RESEARCH METHODOLOGY
1. WORLD SALT MARKET
1.1. Commodity overview
salt application spheres
salt worldwide resources
salt substitutes
1.2. Salt world market development in 2019-2024
salt production globally
major manufacturers’ profiles
salt demand, consumption structure
1.3. Salt prices in global market
2. EUROPEAN MARKET OF SALT
2.1. Bulgaria salt market in 2019-2024
salt production in Bulgaria
salt demand in Bulgaria
trade of salt in Bulgaria
prices of salt in Bulgaria
2.2. Italy salt market in 2019-2024
salt production in Italy
salt demand in Italy
trade of salt in Italy
prices of salt in Italy
2.3. France salt market in 2019-2024
salt production in France
salt demand in France
trade of salt in France
prices of salt in France
2.4. Germany salt market in 2019-2024
salt production in Germany
salt demand in Germany
trade of salt in Germany
prices of salt in Germany
2.5. Netherlands salt market in 2019-2024
salt production in Netherlands
salt demand in Netherlands
trade of salt in Netherlands
prices of salt in Netherlands
2.6. Poland salt market in 2019-2024
salt production in Poland
salt demand in Poland
trade of salt in Poland
prices of salt in Poland
2.7. Romania salt market in 2019-2024
salt production in Romania
salt demand in Romania
trade of salt in Romania
prices of salt in Romania
2.8. Spain salt market in 2019-2024
salt production in Spain
salt demand in Spain
trade of salt in Spain
prices of salt in Spain
2.9. The UK salt market in 2019-2024
salt production in the UK
salt demand in the UK
trade of salt in the UK
prices of salt in the UK
3. CIS COUNTRIES MARKET OF SALT
3.1. Belarus salt market in 2019-2024
salt production in Belarus
salt demand in Belarus
trade of salt in Belarus
prices of salt in Belarus
3.2. Russia salt market in 2019-2024
salt production in Russia
salt demand in Russia
trade of salt in Russia
prices of salt in Russia
3.3. Ukraine salt market in 2019-2024
salt production in Ukraine
salt demand in Ukraine
trade of salt in Ukraine
prices of salt in Ukraine
4. ASIA PACIFIC MARKET OF SALT
4.1. Australia salt market in 2019-2024
salt production in Australia
salt demand in Australia
trade of salt in Australia
prices of salt in Australia
4.2. China salt market in 2019-2024
salt production in China
salt demand in China
trade of salt in China
prices of salt in China
4.3. India salt market in 2019-2024
salt production in India
salt demand in India
trade of salt in India
prices of salt in India
4.4. Pakistan salt market in 2019-2024
salt production in Pakistan
salt demand in Pakistan
trade of salt in Pakistan
prices of salt in Pakistan
4.5. Thailand salt market in 2019-2024
salt production in Thailand
salt demand in Thailand
trade of salt in Thailand
prices of salt in Thailand
5. NORTH AMERICAN MARKET OF SALT
5.1. Canada salt market in 2019-2024
salt production in Canada
salt demand in Canada
trade of salt in Canada
prices of salt in Canada
5.2. USA salt market in 2019-2024
salt production in USA
salt demand in USA
trade of salt in USA
prices of salt in USA
6. LATIN AMERICAN MARKET OF SALT
6.1. Argentina salt market in 2019-2024
salt production in Argentina
salt demand in Argentina
trade of salt in Argentina
prices of salt in Argentina
6.2. Brazil salt market in 2019-2024
salt production in Brazil
salt demand in Brazil
trade of salt in Brazil
prices of salt in Brazil
6.3. Chile salt market in 2019-2024
salt production in Chile
salt demand in Chile
trade of salt in Chile
prices of salt in Chile
6.4. Mexico salt market in 2019-2024
salt production in Mexico
salt demand in Mexico
trade of salt in Mexico
prices of salt in Mexico
7. MIDDLE EAST AND AFRICAN MARKET OF SALT
7.1. Egypt salt market in 2019-2024
salt production in Egypt
salt demand in Egypt
trade of salt in Egypt
prices of salt in Egypt
7.2. Iran salt market in 2019-2024
salt production in Iran
salt demand in Iran
trade of salt in Iran
prices of salt in Iran
7.3. Turkey salt market in 2019-2024
salt production in Turkey
salt demand in Turkey
trade of salt in Turkey
prices of salt in Turkey
7.4. Saudi Arabia salt market in 2019-2024
salt production in Saudi Arabia
salt demand in Saudi Arabia
trade of salt in Saudi Arabia
prices of salt in Saudi Arabia
8. SALT MARKET FORECAST TO 2034
8.1. World salt market trends up to 2034
8.2. Salt supply forecast to 2034: volumes and dynamics
8.3. World salt demand forecast to 2034: volumes and dynamics
9. SALT DOWNSTREAM MARKETS TRENDS AND PROSPECTS
World salt production in 2019-2024
World salt production by country
Salt demand globally in 2019-2024
Salt demand in Europe in 2019-2024
Salt demand in Asia in 2019-2024
Salt demand in North America in 2019-2024
Salt demand in RoW in 2019-2024
Salt supply and demand in Bulgaria in 2019-2024
Trade of salt in Bulgaria
Salt prices in Bulgaria
Salt supply and demand in Italy in 2019-2024
Trade of salt in Italy
Salt prices in Italy
Salt supply and demand in France in 2019-2024
Trade of salt in France
Salt prices in France
Salt supply and demand in Germany in 2019-2024
Trade of salt in Germany
Salt prices in Germany
Salt supply and demand in Netherlands in 2019-2024
Trade of salt in Netherlands
Salt prices in Netherlands
Salt supply and demand in Poland in 2019-2024
Trade of salt in Poland
Salt prices in Poland
Salt supply and demand in Romania in 2019-2024
Trade of salt in Romania
Salt prices in Romania
Salt supply and demand in Spain in 2019-2024
Trade of salt in Spain
Salt prices in Spain
Salt supply and demand in the UK in 2019-2024
Trade of salt in the UK
Salt prices in the UK
Salt supply and demand in Belarus in 2019-2024
Trade of salt in Belarus
Salt prices in Belarus
Salt supply and demand in Russia in 2019-2024
Trade of salt in Russia
Salt prices in Russia
Salt supply and demand in Ukraine in 2019-2024
Trade of salt in Ukraine
Salt prices in Ukraine
Salt supply and demand in Australia in 2019-2024
Trade of salt in Australia
Salt prices in Australia
Salt supply and demand in China in 2019-2024
Trade of salt in China
Salt prices in China
Salt supply and demand in India in 2019-2024
Trade of salt in India
Salt prices in India
Salt supply and demand in Canada in 2019-2024
Trade of salt in Canada
Salt prices in Canada
Salt supply and demand in USA in 2019-2024
Trade of salt in USA
Salt prices in USA
Salt supply and demand in Argentina in 2019-2024
Trade of salt in Argentina
Salt prices in Argentina
Salt supply and demand in Brazil in 2019-2024
Trade of salt in Brazil
Salt prices in Brazil
Salt supply and demand in Chile in 2019-2024
Trade of salt in Chile
Salt prices in Chile
Salt supply and demand in Mexico in 2019-2024
Trade of salt in Mexico
Salt prices in Mexico
Salt supply and demand in Egypt in 2019-2024
Trade of salt in Egypt
Salt prices in Egypt
Salt supply and demand in Iran in 2019-2024
Trade of salt in Iran
Salt prices in Iran
Salt supply and demand in Turkey in 2019-2024
Trade of salt in Turkey
Salt prices in Turkey
Salt supply and demand in Saudi Arabia in 2019-2024
Trade of salt in Saudi Arabia
Salt prices in Saudi Arabia
Salt global market forecast up to 2034
Salt market forecast in Europe up to 2034
Salt market forecast in Asia up to 2034
Salt market forecast in North America up to 2034
Salt market forecast in RoW up to 2034
Detailed analysis of salt market in a country is available covering data on capacity (by plant), production, consumption, trade, prices and market forecast.
Please select a country from the list below (if you do not find a market report you would be interested in, please contact a member of our team - [email protected]).
Ask a question or Order by email
More Reports
| Title | Date | Pages | Price |
|---|---|---|---|
| Oct, 2025 | 132 | US$ 3,300.00 | |
| Oct, 2025 | 30 | US$ 1,050.00 | |
| Oct, 2025 | 30 | US$ 1,050.00 | |
| Oct, 2025 | 30 | US$ 1,050.00 | |
| Oct, 2025 | 30 | US$ 1,050.00 | |
| Oct, 2025 | 30 | US$ 1,050.00 | |
| Oct, 2025 | 30 | US$ 1,050.00 | |
| Oct, 2025 | 30 | US$ 1,050.00 | |
| Oct, 2025 | 30 | US$ 1,050.00 | |
| Oct, 2025 | 30 | US$ 1,050.00 | |
| Oct, 2025 | 30 | US$ 1,050.00 | |
| Oct, 2025 | 30 | US$ 1,050.00 | |
| Oct, 2025 | 30 | US$ 1,050.00 | |
| Oct, 2025 | 30 | US$ 1,050.00 | |
| Oct, 2025 | 31 | US$ 1,050.00 | |
| Oct, 2025 | 30 | US$ 1,050.00 |