Cobalt Global Market Forecast to 2034, Historical Data of 2019-2024, Supply and Demand, Volume and Value, Manufacturers, Prices, Upstream and Downstream Trends
About Cobalt Market
- cooper and nickel mining is the main industrial source of by-product cobalt
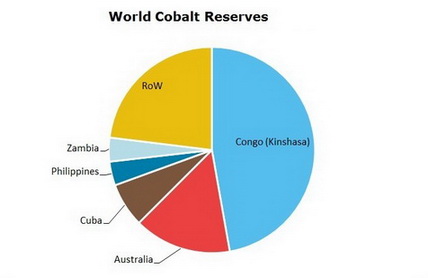
- Congo (Kinshasa) is the leading mining producer of cobalt while China manufactures the largest volume of refined metal
- world cobalt demand is driven by increasing production of super alloys and rechargeable batteries
- overall, there are good opportunities for cobalt in the battery market as the metal is one of the basic components for their production (apart from lithium and graphite)
- new companies will enter global cobalt market, several projects have been announced
Cobalt Market Review is a source for detailed information on the market situation. The report contains descriptive and analytical parts, enriched with tables and figures for national and global markets. Market forecasts for the next ten years complete the report.
Scope
Geographically report covers:
- World
- Countries
Timeframe of market report:
- Present situation
- Historical background
- Ten-year forecast
Global market analysis includes:
- Production and consumption
- Prices
- 10-year market forecast
- Projects
- Downstream markets
A region/country market overview comprises:
- Production/consumption balance
- Export and import
- Manufacturers
Reasons to Buy
The immediate benefits of buying this report are as follows:
- Detailed statistics give clear picture of current market situation;
- Extensive price charts draw particular pricing trends in the recent years;
- Production/consumption charts backed with export/import tables outline country’s market position and value;
- Search for partners and suppliers is facilitated;
- Distinct market forecast aids the decision-making process.
*Please note that "Cobalt Market Forecast, Trends, Supply and Demand, Prices, Projects, Manufacturers" is a half ready publication and contents are subject to changes and additions. We have all data necessary for report preparation but it needs to be retrieved from our databases, organized in a report, updated with the latest information and thus the complete study will be presented. This process takes 4-5 business days after the order is placed. Thus, our clients always obtain a revised and updated version of each report. Please note that we do not charge for an updating procedure.
DISCLAIMER
RESEARCH METHODOLOGY
1. WORLD COBALT MARKET
1.1. Commodity overview
Description
Application spheres
Worldwide resources
Substitutes
1.2. Cobalt market in 2019-2024
Mine production
Refinery production
Major manufacturers’ profiles
Demand, consumption structure
1.3. Prices
2. EUROPEAN MARKET OF COBALT
Here and after a country cobalt market analysis covers the following (depending on market):
– mine production in 2019-2024
– refinery production in 2019-2024
– consumption in 2019-2024
– export and import of cobalt ores and concentrates
2.1. Belgium
2.2. Finland
2.3. France
2.4. Norway
3. CIS COUNTRIES MARKET OF COBALT
3.1. Russia
4. ASIA PACIFIC MARKET OF COBALT
4.1. Australia
4.2. India
4.3. Indonesia
4.4. Japan
4.5. New Caledonia
4.6. Philippines
5. NORTH AMERICAN MARKET OF COBALT
5.1. Canada
6. LATIN AMERICAN MARKET OF COBALT
6.1. Brazil
6.2. Cuba
7. AFRICAN MARKET OF COBALT
7.1. Botswana
7.2. Congo
7.3. Madagascar
7.4. Morocco
7.5. South Africa
7.6. Uganda
7.7. Zambia
7.8. Zimbabwe
8. COBALT MARKET FORECAST TO 2034
8.1. Market trends up to 2034
8.2. Supply forecast
8.3. Demand forecast, downstream markets prospects
World reserves of cobalt in 2024
World mine production
World mine production by country
World refinery production
World refinery production by country
Cobalt supply/demand in Belgium
Trade of ores and concentrates in Belgium
Cobalt supply/demand in Finland
Trade of ores and concentrates in Finland
Cobalt supply/demand in France
Metal supply/demand in Norway
Cobalt supply/demand in Russia
Trade of ores and concentrates in Russia
Cobalt supply/demand in Australia
Trade of ores and concentrates in Australia
Cobalt supply/demand in India
Trade of ores and concentrates in India
Cobalt supply/demand in Indonesia
Trade of ores and concentrates in Indonesia
Cobalt supply/demand in Japan
Trade of ores and concentrates in Japan
Cobalt supply/demand in Philippines
Trade of ores and concentrates in Philippines
Metal supply/demand in Canada
Trade of ores and concentrates in Canada
Metal supply/demand in USA
Trade of ores and concentrates in USA
Cobalt supply/demand in Cuba
Trade of ores and concentrates in Cuba
Cobalt supply/demand in Congo
Trade of ores and concentrates in Congo
Cobalt supply in Madagascar
Metal supply in Morocco
Cobalt supply/demand in South Africa
Trade of ores and concentrates in South Africa
Cobalt supply in Uganda
Metal supply/demand in Zambia
Trade of ores and concentrates in Zambia
Cobalt market forecast up to 2034
Detailed analysis of cobalt market in a country is available covering data on capacity (by plant), production, consumption, trade, prices and market forecast.
Please select a country from the list below (if you do not find a market report you would be interested in, please contact a member of our team - [email protected]).
Ask a question or Order by email
Cobalt Market Monitoring
For this report we offer a Monthly Update Service covering prices,
market news and companies activities.
More Reports
| Title | Date | Pages | Price |
|---|---|---|---|
| Apr, 2025 | 218 | US$ 3,300.00 | |
| Apr, 2025 | 175 | US$ 3,300.00 | |
| Apr, 2025 | 248 | US$ 3,300.00 | |
| Apr, 2025 | 80 | US$ 2,300.00 | |
| Apr, 2025 | 424 | US$ 3,499.00 | |
| Apr, 2025 | 30 | US$ 1,050.00 | |
| Apr, 2025 | 30 | US$ 1,050.00 | |
| Apr, 2025 | 30 | US$ 1,050.00 | |
| Apr, 2025 | 30 | US$ 1,050.00 | |
| Apr, 2025 | 30 | US$ 1,050.00 | |
| Apr, 2025 | 30 | US$ 1,050.00 | |
| Apr, 2025 | 30 | US$ 1,050.00 | |
| Apr, 2025 | 30 | US$ 1,050.00 | |
| Apr, 2025 | 30 | US$ 1,050.00 | |
| Apr, 2025 | 30 | US$ 1,050.00 | |
| Apr, 2025 | 30 | US$ 1,050.00 | |
| Apr, 2025 | 30 | US$ 1,050.00 | |
| Apr, 2025 | 34 | US$ 1,050.00 |