Tin: 2026 World Market Review and Forecast to 2035
About Tin Market
- since the ban of lead in electronics tin (Sn) application in solder has become the main use
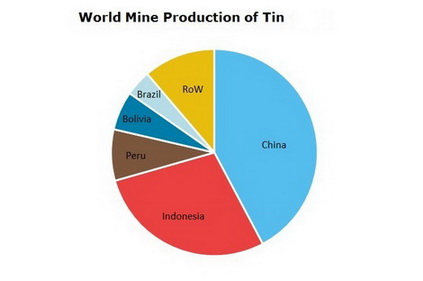
- China, Indonesia and Peru provide about 80% of global Sn mine production
- demand for tin is set to increase with electronics being the main downstream market
- Sn application in Li-ion batteries will also stimulate demand growth as this industry is actively developing
- Indonesian export regulations influence the global supply; potential supply shortage may appear in the coming years
- on the other hand, there is new emerging player in the global tin market – Myanmar, which can provide up to 10% of global output
Tin Market Review is a source for detailed information on the market situation. The report contains descriptive and analytical parts, enriched with tables and figures for national and global markets. Market forecasts for the next ten years complete the report.
Scope
Geographically the market report covers:
- World
- Countries
Timeframe of market report:
- Present situation
- Historical background
- Ten-year forecast
Global market analysis includes:
- Production and consumption
- Prices
- 10-year market forecast
- Projects
- Downstream markets
A region/country market overview comprises:
- Production/consumption balance
- Export and import
- Manufacturers
Reasons to Buy
The immediate benefits of buying this report are as follows:
- Detailed statistics give clear picture of current market situation;
- Extensive price charts draw particular pricing trends in the recent years;
- Production/consumption charts backed with export/import tables outline country’s market position and value;
- Search for partners and suppliers is facilitated;
- Distinct market forecast aids the decision-making process.
*Please note that "Tin: 2026 World Market Review and Forecast" is a half ready publication and contents are subject to changes and additions. We have all data necessary for report preparation but it needs to be retrieved from our databases, organized in a report, updated with the latest information and thus the complete study will be presented. This process takes 4-5 business days after the order is placed. Thus, our clients always obtain a revised and updated version of each report. Please note that we do not charge for an updating procedure.
DISCLAIMER
RESEARCH METHODOLOGY
1. WORLD TIN MARKET
1.1. Commodity overview
Description
Application spheres
Worldwide resources
Substitutes
1.2. Commodity market in 2020-2025
Mine/smelter production
Major manufacturers’ profiles
Demand, consumption structure
1.3. Prices
2. EUROPEAN MARKET
Here and after a country market analysis covers the following (depending on market):
– mine/smelter production in 2020-2025
– consumption in 2020-2025
– export and import of:
tin ores and concentrates
unwrought tin (not alloyed)
unwrought tin alloys
tin waste and scrap
2.1. Belgium
2.2. Denmark
3. CIS COUNTRIES MARKET
3.1. Russia
4. ASIA PACIFIC MARKET
4.1. Australia
4.2. Myanmar
4.3. China
4.4. Indonesia
4.5. Japan
4.6. Malaysia
4.7. Thailand
4.8. Vietnam
5. NORTH AMERICAN MARKET
5.1. USA
6. LATIN AMERICAN MARKET
6.1. Bolivia
6.2. Brazil
6.3. Peru
7. AFRICAN MARKET
7.1. Congo
7.2. Nigeria
7.3. Rwanda
8. TIN MARKET FORECAST TO 2035
8.1. Market trends up to 2035
8.2. Supply forecast, projects
8.3. Demand forecast, downstream markets prospects
World reserves of tin in 2025
World mine production
World mine production by country
World smelter production
World smelter production by country
Tin supply/demand in Belgium market
Trade of:
unwrought tin (not alloyed) in Belgium
unwrought tin alloys in Belgium
metal waste and scrap in Belgium
Metal supply/demand in Denmark market
Trade of unwrought tin (not alloyed) in Denmark
Metal supply/demand in Russia market
Trade of:
ores and concentrates in Russia
unwrought tin (not alloyed) in Russia
unwrought tin alloys in Russia
metal waste and scrap in Russia
Metal supply/demand in Australia market
Trade of:
ores and concentrates in Australia
unwrought tin (not alloyed) in Australia
unwrought tin alloys in Australia
metal waste and scrap in Australia
Metal supply/demand in Myanmar
Trade of metal ores and concentrates in Myanmar
Metal supply/demand in China market
Trade of:
ores and concentrates in China
unwrought tin (not alloyed) in China
unwrought tin alloys in China
Metal supply/demand in Indonesia market
Trade of:
tin ores and concentrates in Indonesia
unwrought tin (not alloyed) in Indonesia
unwrought tin alloys in Indonesia
metal waste and scrap in Indonesia
Metal supply/demand in Japan market
Trade of:
unwrought tin (not alloyed) in Japan
unwrought tin alloys in Japan
Metal supply/demand in Malaysia market
Trade of:
ores and concentrates in Malaysia
unwrought tin (not alloyed) in Malaysia
unwrought tin alloys in Malaysia
metal waste and scrap in Malaysia
Metal supply/demand in Thailand market
Trade of:
tin ores and concentrates in Thailand
unwrought tin (not alloyed) in Thailand
unwrought tin alloys in Thailand
metal waste and scrap in Thailand
Metal supply/demand in Vietnam market
Trade of:
unwrought tin (not alloyed) in Vietnam
unwrought tin alloys in Vietnam
Metal supply/demand in USA market
Trade of:
tin ores and concentrates in USA
unwrought tin (not alloyed) in USA
unwrought tin alloys in USA
metal waste and scrap in USA
Metal supply/demand in Bolivia market
Trade of:
tin ores and concentrates in Bolivia
unwrought tin (not alloyed) in Bolivia
unwrought tin alloys in Bolivia
Metal supply/demand in Brazil market
Trade of:
tin ores and concentrates in Brazil
unwrought Sn (not alloyed) in Brazil
unwrought tin alloys in Brazil
metal waste and scrap in Brazil
Metal supply/demand in Peru
Trade of unwrought Sn (not alloyed) in Peru
Metal supply/demand in Congo
Trade of metal ores and concentrates in Congo
Metal supply/demand in Nigeria
Trade of metal ores and concentrates in Nigeria
Metal supply/demand in Rwanda
Trade of metal ores and concentrates in Rwanda
Market forecast up to 2035
Detailed analysis of tin market in a country is available covering data on capacity (by plant), production, consumption, trade, prices and market forecast.
Please select a country from the list below (if you do not find a market report you would be interested in, please contact a member of our team - [email protected]).
Ask a question or Order by email
Tin Market Monitoring
For this report we offer a Monthly Update Service covering prices,
market news and companies activities.
More Reports
| Title | Date | Pages | Price |
|---|---|---|---|
| Jun, 2026 | 320 | US$ 3,300.00 | |
| Jun, 2026 | 424 | US$ 3,499.00 | |
| Jun, 2026 | 300 | US$ 3,300.00 | |
| Jun, 2026 | 30 | US$ 1,050.00 | |
| Jun, 2026 | 30 | US$ 1,050.00 | |
| Jun, 2026 | 30 | US$ 1,050.00 | |
| Jun, 2026 | 30 | US$ 1,050.00 | |
| Jun, 2026 | 30 | US$ 1,050.00 | |
| Jun, 2026 | 30 | US$ 1,050.00 | |
| Jun, 2026 | 30 | US$ 1,050.00 | |
| Jun, 2026 | 30 | US$ 1,050.00 |